【GDB】GDB多线程查看线程堆栈 |
您所在的位置:网站首页 › gdb 多线程 设置断点 › 【GDB】GDB多线程查看线程堆栈 |
【GDB】GDB多线程查看线程堆栈
|
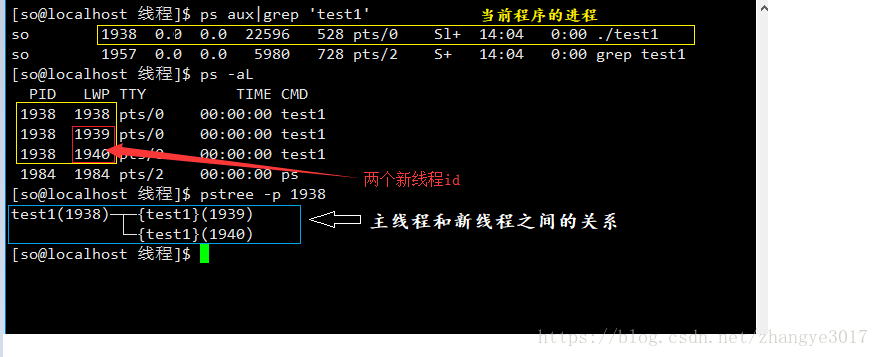
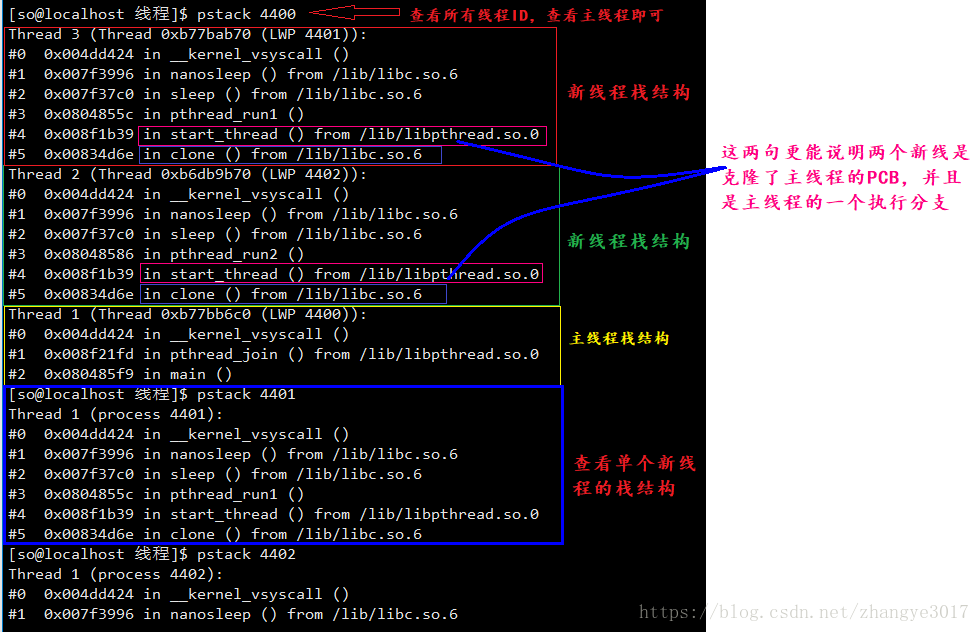
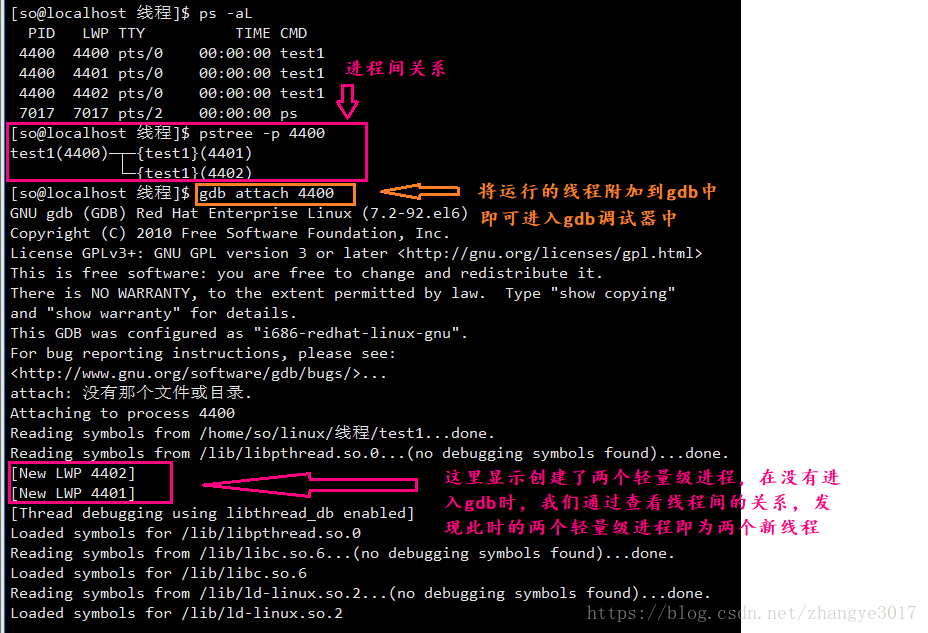
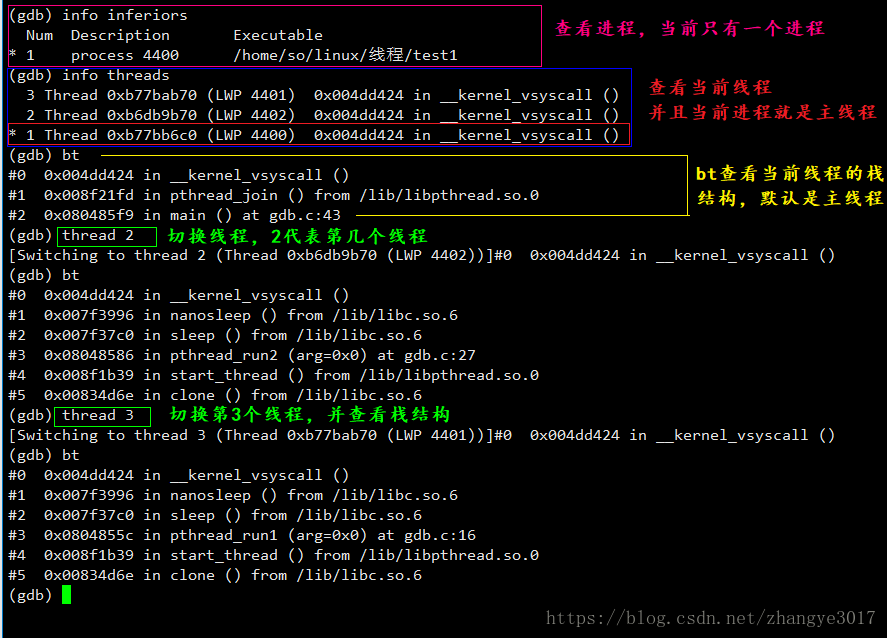
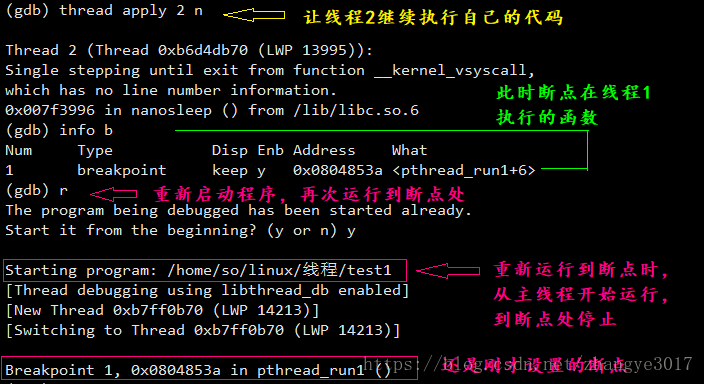
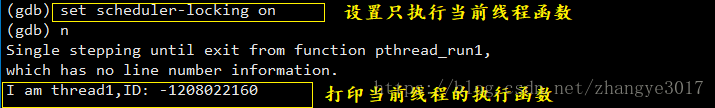
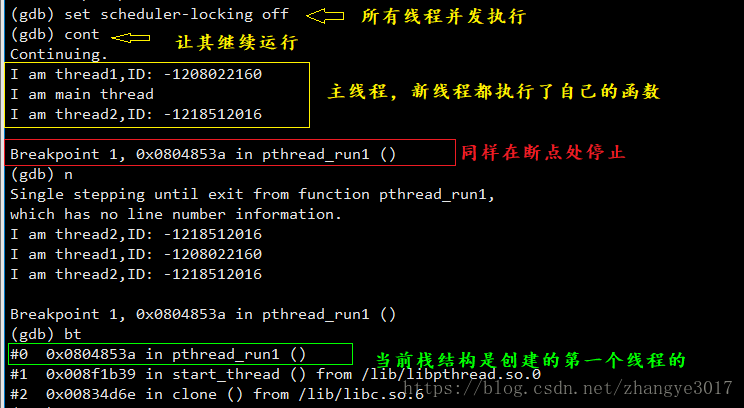
目录 GDB多线程查看崩溃时线程的堆栈 线程的查看以及利用gdb调试多线程 GDB 调试多线程和多进程总结 排除步骤 调试多进程 一、gdb的基础知识复习 二、使用gdb调试多进程 三,gdb 调试多线程 四、设置线程名字(便于分析) linuxGDB下动态链接库的调试 GDB设置线程锁(一个线程动其他不动) 作者:bandaoyu 链接:https://blog.csdn.net/bandaoyu/article/details/120552039 GDB多线程查看崩溃时线程的堆栈例子 2021-09-29 16:37:17.931204 7fff637f7700 422708 59 ERROR RDMAStack in polling_start 2021-09-29 16:37:17.931227 7fff637f7700 422708 59 ERROR RDMAStack polling_start start polling thread:1 [New Thread 0x7fff4475f700 (LWP 423826)] 2021-09-29 16:37:17.937471 7fff637f7700 422708 59 ERROR RDMAStack polling_start start: 1 handle_rx_fun threads 2021-09-29 16:37:17.937488 7fff637f7700 422708 59 ERROR RDMAStack polling_start start: handle_rx_fun thread [New Thread 0x7fff43f5e700 (LWP 423827)] 2021-09-29 16:37:17.938410 7fff4475f700 423826 18 ERROR RDMAStack max_num:1 bf_num: 2021-09-29 16:37:17.938437 7fff4475f700 423826 18 ERROR RDMAStack busy_polling bf_num: tail: terminate called without an active exception 2021-09-29 16:37:17.938455 7fff4475f700 423826 18 ERROR RDMAStack max_num:1 bf_num: tail: 2021-09-29 16:37:17.938459 7fff4475f700 423826 18 ERROR RDMAStack busy_polling bf_num: tail: 2021-09-29 16:37:17.938464 7fff4475f700 423826 18 ERROR RDMAStack max_num:1 bf_num: tail: 2021-09-29 16:37:17.938467 7fff4475f700 423826 18 ERROR RDMAStack busy_polling bf_num: tail: 2021-09-29 16:37:17.938473 7fff4475f700 423826 18 ERROR RDMAStack max_num:1 bf_num: tail: 2021-09-29 16:37:17.938476 7fff4475f700 423826 18 ERROR RDMAStack busy_polling bf_num: tail: 2021-09-29 16:37:17.938481 7fff4475f700 423826 18 ERROR RDMAStack max_num:1 bf_num: tail: 2021-09-29 16:37:17.938484 7fff4475f700 423826 18 ERROR RDMAStack busy_polling bf_num: tail: 2021-09-29 16:37:17.938494 7fff4475f700 423826 18 ERROR RDMAStack max_num:1 bf_num: tail: 2021-09-29 16:37:17.938498 7fff4475f700 423826 18 ERROR RDMAStack busy_polling bf_num: tail:Program received signal SIGABRT, Aborted.[Switching to Thread 0x7fff637f7700 (LWP 422708)] 0x00007fffeb4b3387 in raise () from /lib64/libc.so.6上面表示 程序abort了。abort之前在线程7fff4475f700运行 (abort之前在这个线程,并不一定是这个线程引起的),abort之后程序切换到0x7fff637f7700线程。 (gdb) i threads 查看线程信息 查看到线程7fff4475f700的 id 是79,而当前在线程12 (前面有*号) (gdb) i threads Id Target Id Frame 80 Thread 0x7fff43f5e700 (LWP 423827) "io-workerb-0" 0x00007fffefaafc98 in LC_GetThreadIndex (threadId=423827) at /home/lcx/ceph-L/src/umm/localcache.c:41 79 Thread 0x7fff4475f700 (LWP 423826) "io-workerb-0" 0x00007fffeb570ccd in poll () from /lib64/libc.so.6 78 Thread 0x7fff4a05c700 (LWP 423816) "ms_local" 0x00007fffeca95a35 in pthread_cond_wait@@GLIBC_2.3.2 () from /lib64/libpthread.so.0 77 Thread 0x7fff4a85d700 (LWP 423815) "ms_dispatch" 0x00007fffeca95a35 in …… 13 Thread 0x7fff62ff6700 (LWP 422709) "io-workerb-1" 0x00007fffeb57bfd3 in epoll_wait () from /lib64/libc.so.6 * 12 Thread 0x7fff637f7700 (LWP 422708) "io-workerb-0" 0x00007fffeb4b3387 in raise () from /lib64/libc.so.6 11 Thread 0x7fff63ff8700 (LWP 422702) "io-worker-2" 0x00007fffeb57bfd3 in epoll_wait () from (gdb) thread 79 切换到线程79 (gdb) thread 79 [Switching to thread 79 (Thread 0x7fff4475f700 (LWP 423826))] #0 0x00007fffeb570ccd in poll () from /lib64/libc.so.6(gdb) bt 查看线程 79的调用堆栈 (gdb) bt #0 0x00007fffeb570ccd in poll () from /lib64/libc.so.6 #1 0x00007fffec815c3b in co::libgo_poll (fds=0x7fff4475d2b0, nfds=2, timeout=200, nonblocking_check=true) at /compiledir/zhangtao/workspace/Libgo/libgo/netio/unix/hook.cpp:84 #2 0x00007fffec80ccdc in poll (fds=0x7fff4475d2b0, nfds=2, timeout=200) at /compiledir/zhangtao/workspace/Libgo/libgo/netio/unix/hook.cpp:477 #3 0x00005555562b24cb in RDMADispatcher::busy_polling() () #4 0x00007fffebe18360 in ?? () from /opt/h3c/lib/libstdc++.so.6 #5 0x00007fffeca91ea5 in start_thread () from /lib64/libpthread.so.0 #6 0x00007fffeb57b9fd in clone () from /lib64/libc.so.6 (gdb) f 3 #3 0x00005555562b24cb in RDMADispatcher::busy_polling() () (gdb) i local No symbol table info available. (gdb) f 2 #2 0x00007fffec80ccdc in poll (fds=0x7fff4475d2b0, nfds=2, timeout=200) at /compiledir/zhangtao/workspace/Libgo/libgo/netio/unix/hook.cpp:477 477 /compiledir/zhangtao/workspace/Libgo/libgo/netio/unix/hook.cpp: 没有那个文件或目录. (gdb) i local tk = 0x0 __FUNCTION__ = "poll" (gdb) i arg fds = 0x7fff4475d2b0 nfds = 2 timeout = 200 (gdb) 线程的查看以及利用gdb调试多线程转自:线程的查看以及利用gdb调试多线程;https://blog.csdn.net/zhangye3017/article/details/80382496 命令行查看: //查看当前运行的进程 ps aux|grep a.out //查看当前运行的轻量级进程 ps -aL|grep a.out //查看主线程和新线程的关系 pstree -p 主线程id2. 线程栈结构的查看 1. 获取线程ID 2. 通过命令查看栈结构 ps stack 线程ID3. 利用gdb查看线程信息 将进程附加到gdb调试器当中,查看是否创建了新线程:gdb attach 主线程ID 2.查看线程的一些信息 //1.查看进程:info inferiors //2.查看线程:info threads //3.查看线程栈结构:bt //4.切换线程:thread n(n代表第几个线程)4. 利用gdb调试多线程 当程序没有启动,线程还没有执行,此时利用gdb调试多线程和调试普通程序一样,通过设置断点,运行,查看信息等等,在这里不在演示,最后会加上调试线程的命令 设置断点 //1. 设置断点:break 行号/函数名 //2. 查看断点:info b 执行线程2的函数,指行完毕继续运行到断点处 1. 继续使某一线程运行:thread apply 1-n(第几个线程) n 2. 重新启动程序运行到断点处:r 只运行当前线程 1. 设置:set scheduler-locking on 2. 运行:n 所有线程并发执行 1. 设置:set scheduler-locking off 2. 运行:n总结调试多线程的命令
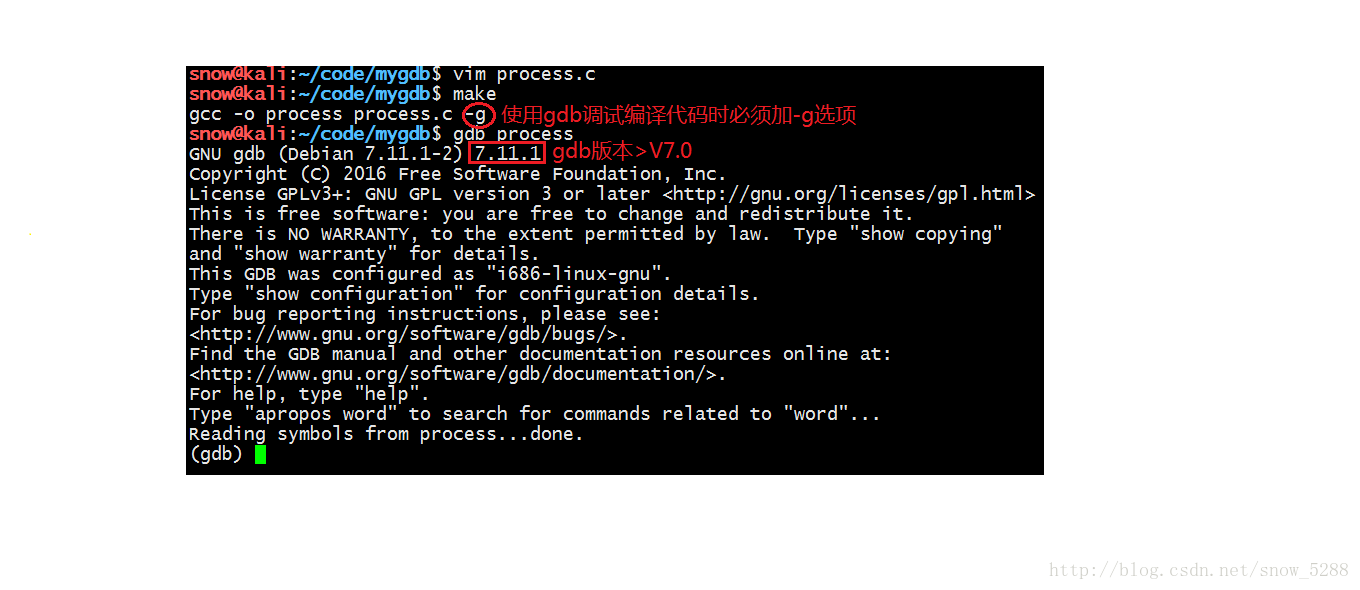
命令 用法 info threads 显示当前可调试的所有线程,每个线程会有一个GDB为其分配的ID,后面操作线程的时候会用到这个ID。 前面有*的是当前调试的线程 thread ID(1,2,3…) 切换当前调试的线程为指定ID的线程 break thread_test.c:123 thread all(例:在相应函数的位置设置断点break pthread_run1) 在所有线程中相应的行上设置断点 thread apply ID1 ID2 command 让一个或者多个线程执行GDB命令command thread apply all command 让所有被调试线程执行GDB命令command set scheduler-locking 选项 command 设置线程是以什么方式来执行命令 set scheduler-locking off 不锁定任何线程,也就是所有线程都执行,这是默认值 set scheduler-locking on 只有当前被调试程序会执行 set scheduler-locking on step 在单步的时候,除了next过一个函数的情况(熟悉情况的人可能知道,这其实是一个设置断点然后continue的行为)以外,只有当前线程会执行 示例代码 #include #include #include #include #include void* pthread_run1(void* arg) { (void)arg; while(1) { printf("I am thread1,ID: %d\n",pthread_self()); sleep(1); } } void* pthread_run2(void* arg) { (void)arg; while(1) { printf("I am thread2,ID: %d\n",pthread_self()); sleep(1); } } int main() { pthread_t tid1; pthread_t tid2; pthread_create(&tid1,NULL,pthread_run1,NULL); pthread_create(&tid2,NULL,pthread_run2,NULL); printf("I am main thread\n"); pthread_join(tid1,NULL); pthread_join(tid2,NULL); return 0; } GDB 调试多线程和多进程总结【GDB】GDB调试总目录_bandaoyu的笔记-CSDN博客【GDB】GDB 调试多线程和多进程总结报错记录(gdb) b mps_guide_db.c:1699No source file named mps_guide_db.c.可能是因为调用了动态库,要打断点的文件是动态库的可以通过 以下方式得到解决:(gdb) set breakpoint pending on(gdb) b db_subscr_no_lookupFunction "db_subscr_no_lookup" not defined.Breakpoint 1 推荐看这个:线程的查看以及利用gdb调试多线程_zhangye3017的博客-CSDN博客_gdb调试多线程 排除步骤 1.ps -eo pid,lstart,cmd | grep proname找出进程的pid2.gdb attach pid。使用gdb attach可以调试正在运行的进程,这对数据不正常的程序很有效。3.info threads查看具体的线程id。然后去日志查看具体的线程id4.thread x切换线程到具体的线程5.在线程中设置断点。6.set scheduler-locking off 让所有的线程运行.gdb默认调试状态下只有当前的线程在运行,所以先要让整个程序运行起来。7.continue让线程运行,等待程序停在断点处,然后info命令查看现场即可。查看本地变量数据的一些技巧: set print pretty on 按格式打印struct结构体时set print union 打印struct时按格式打印内部的unionset print array 按格式打印数组链接:https://www.jianshu.com/p/de9eb764309f 调试多进程 一、gdb的基础知识复习1>介绍: gdb是Linux环境下的代码调试工具。 2>使用:需要在源代码生成的时候加上 -g 选项. 3>开始使用: gdb binFile 4>退出:ctrl + d 或 quit 5>调试过程中的常用命令: list/l 行号:显示binFile源代码,接着上次的位置往下列,每次列10行。 list/l 函数名:列出某个函数的源代码。 r或run:运行程序。 s或step:进入函数调用 breaktrace(bt):查看各级函数调用及参数 info(i) locals:查看当前栈帧局部变量的值 info break :查看断点信息。 finish:执行到当前函数返回,然后挺下来等待命令 print(p):打印表达式的值,通过表达式可以修改变量的值或者调用函数 set var:修改变量的值 quit:退出gdb break(b) 行号:在某一行设置断点 break 函数名:在某个函数开头设置断点 continue(或c):从当前位置开始连续而非单步执行程序 run(或r):从开始连续而非单步执行程序 delete breakpoints:删除所有断点 delete breakpoints n:删除序号为n的断点 disable breakpoints:禁用断点 enable breakpoints:启用断点 info(或i) breakpoints:参看当前设置了哪些断点 display 变量名:跟踪查看一个变量,每次停下来都显示它的值 undisplay:取消对先前设置的那些变量的跟踪 until X行号:跳至X行 p 变量:打印变量值 n 或 next:单条执行 二、使用gdb调试多进程 1 ,调试代码 #include #include #include #include #include int main() { pid_t pid = fork();//创建子进程 if(pid == -1) { perror("fork error"); return -1; } else if(pid == 0)//child { printf("i am a child:my pid is %d,my father is %d\n",getpid(),getppid()); } else//father { printf("i am a father:my pid is %d\n",getpid()); wait(NULL);//等待子进程 } return 0; }2,默认设置下,在调试多进程程序时GDB只会调试主进程。但是GDB(>V7.0)支持多进程的分别以及同时调试,换句话说,GDB可以同时调试多个程序。只需要设置follow-fork-mode(默认值:parent)和detach-on-fork(默认值:on)即可。 follow-fork-mode detach-on-fork 说明: parent on 只调试主进程(GDB默认) child on 只调试子进程 parent off 同时调试两个进程,gdb跟主进程,子进程block在fork位置 child off 同时调试两个进程,gdb跟子进程,主进程block在fork位置 1>进入gdb调试模式:
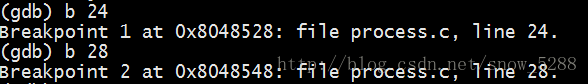
下断点:
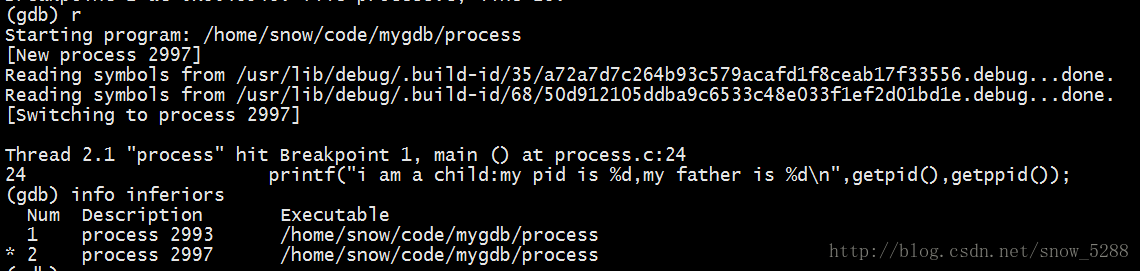
5>运行程序,查询正在调试的进程: 显示GDB调试的所有inferior,GDB会为他们分配ID。其中带有*的进程是正在调试的inferior。( GDB将每一个被调试程序的执行状态记录在一个名为inferior的结构中。一般情况下一个inferior对应一个进程,每个不同的inferior有不同的地址空间。inferior有时候会在进程没有启动的时候就存在。) run info inferiors
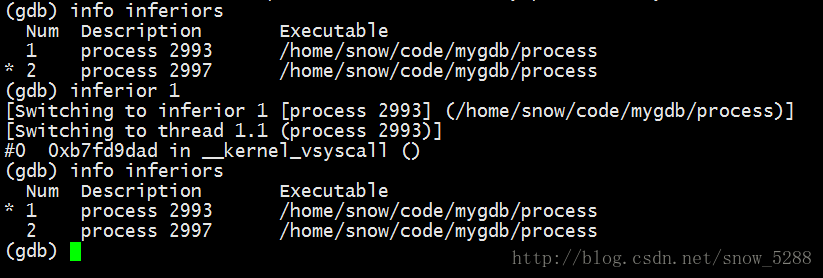
6> 切换调试的进程: inferior
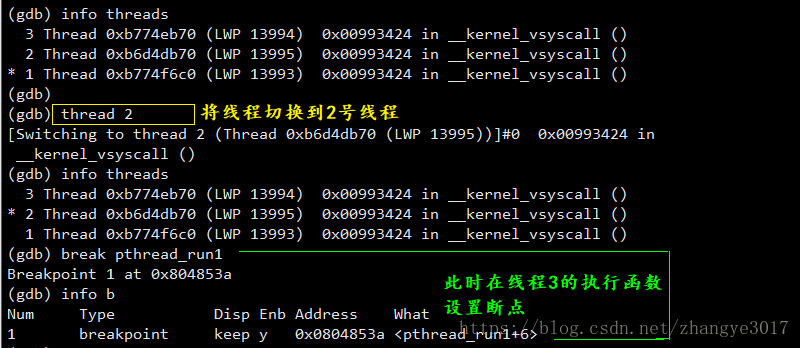
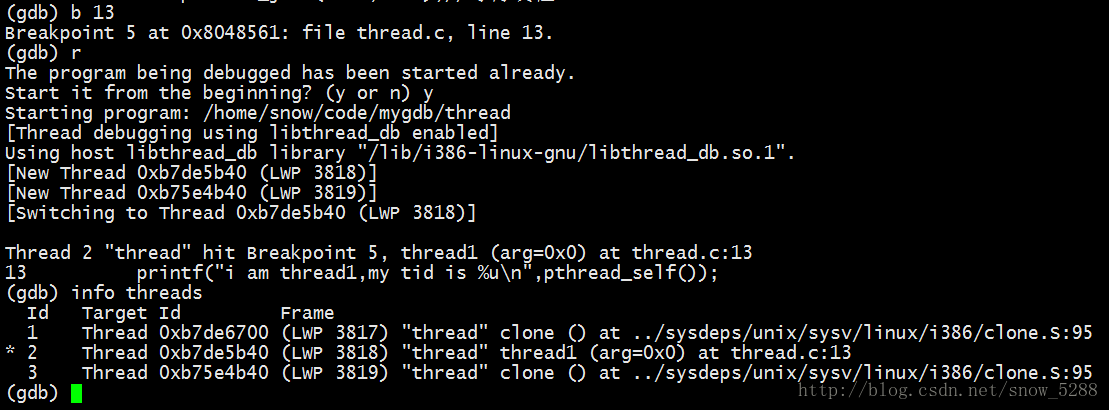
(1)add-inferior [-copies n] [-exec executable] 添加新的调试进程,可以用file executable来分配给inferior可执行文件。增加n个inferior并执行程序为executable。如果不指定n只增加一个inferior。如果不指定executable,则执行程序留空,增加后可使用file命令重新指定执行程序。这时候创建的inferior其关联的进程并没启动。 (2)remove-inferiors infno 删除一个infno号的inferior。如果inferior正在运行,则不能删除,所以删除前需要先kill或者detach这个inferior。 (3)clone-inferior [-copies n] [infno] 复制n个编号是infno的inferior。如果不指定n的话,就只复制一个inferior。如果不指定infno,则就复制正在调试的inferior。 (4)detach inferior detach掉编号是infno的inferior。注意这个inferior还存在,可以再次用run命令执行它。 (5)kill inferior infno: kill掉infno号inferior。注意这个inferior仍然存在,可以再次用run等命令执行它。 (6)set schedule-multiple on|off 设为off:只有当前inferior会执行。 设为on:全部是执行状态的inferior都会执行。 这个选项类似于多线程调试里的set . (7)scheduler-locking 注意:如果scheduler-locking是指为on,即使schedule-multiple设置为on,也只有当前进程的当前线程会执行。 show schedule-multiple: 查看schedule-multiple的状态。 (8)set follow-exec-mode new|same 设置same:当发生exec的时候,在执行exec的inferior上控制子进程。 设置为new:新建一个inferior给执行起来的子进程。而父进程的inferior仍然保留,当前保留的inferior的程序状态是没有执行。 show follow-exec-mode 查看follow-exec-mode设置的模式。 (9)set print inferior-events on|off 用来打开和关闭inferior状态的提示信息。 show print inferior-events 查看print inferior-events设置的状态。 (10)maint info program-spaces 用来显示当前GDB一共管理了多少地址空间。 三,gdb 调试多线程1,多线程程序举例 /************************************** *文件说明:thread.c *作者:段晓雪 *创建时间:2017年06月10日 星期六 15时24分05秒 *开发环境:Kali Linux/g++ v6.3.0 ****************************************/ #include #include void* thread1(void* arg) { printf("i am thread1,my tid is %u\n",pthread_self()); return NULL; } void* thread2(void* arg) { printf("i am thread2,my tid is %u\n",pthread_self()); return NULL; } int main() { pthread_t tid1,tid2; pthread_create(&tid1,NULL,thread1,NULL);//创建线程1 pthread_create(&tid2,NULL,thread2,NULL);//创建线程2 pthread_join(tid1,NULL);//等待线程1 pthread_join(tid2,NULL);//等待线程2 return 0; }以上代码中,主线程main创建了两个子线程分别是thread1和thread2,所以线程的总数为3个。 2,使用gdb对多线程程序进行调试 在多线程编程时,当我们需要调试时,有时需要控制某些线程停在断点,有些线程继续执行。有时需要控制线程的运行顺序。有时需要中断某个线程,切换到其他线程。这些都可以通过gdb实现。 GDB默认支持调试多线程,跟主线程,子线程block在create thread。 gdb调试多线程常用命令: (1)info threads 显示可以调试的所有线程。gdb会为每个线程分配一个ID(和tid不同),编号一般从1开始。后面的ID是指这个ID。 1>在主线程处打断点
由于断点在第25行,线程1和线程2还没创建,所以可以调试的只有一个主线程。 2>在线程1中打断点
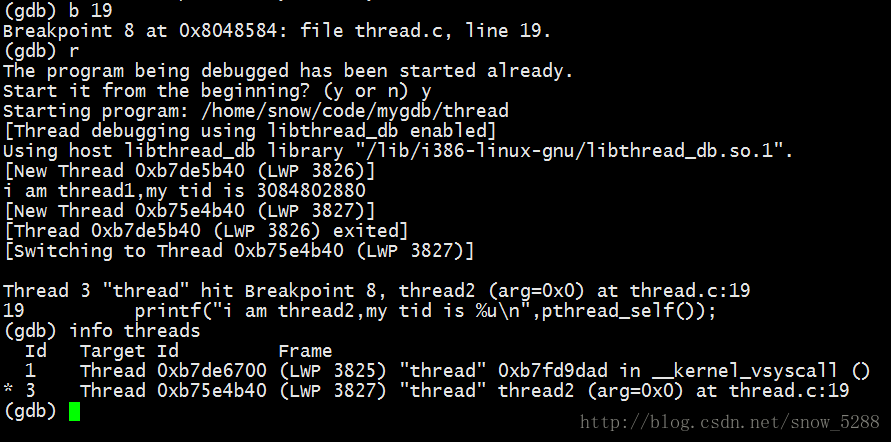
断点设置在线程1中,显示可以调试的线程有3个,正在运行的为线程1. 3>在线程2中打断点
断点设置在19行(线程2中),由于线程1已经运行完毕,所以可以调试的线程只有两个,正在运行的为线程2。 (2)thread ID (3)其他 break FileName.cpp:LinuNum thread all: 所有线程都在文件FileName.cpp的第LineNum行有断点。 thread apply ID1 ID2 IDN command: 让线程编号是ID1,ID2…等等的线程都执行command命令。 thread apply all command:所有线程都执行command命令。 set scheduler-locking off|on|step: 在调式某一个线程时,其他线程是否执行。在使用step或continue命令调试当前被调试线程的时候,其他线程也是同时执行的,如果我们只想要被调试的线程执行,而其他线程停止等待,那就要锁定要调试的线程,只让他运行。 off:不锁定任何线程,默认值。 on:锁定其他线程,只有当前线程执行。 step:在step(单步)时,只有被调试线程运行。 set non-stop on/off: 当调式一个线程时,其他线程是否运行。 set pagination on/off: 在使用backtrace时,在分页时是否停止。 set target-async on/ff: 同步和异步。同步,gdb在输出提示符之前等待程序报告一些线程已经终止的信息。而异步的则是直接返回。 show scheduler-locking: 查看当前锁定线程的模式 原文链接:https://blog.csdn.net/snow_5288/article/details/72982594 四、设置线程名字(便于分析)pthread_create(&thread_id, NULL, synthetic_client_thread_entry, this); assert(thread_id); ceph_pthread_setname(thread_id, "client"); #if defined(HAVE_PTHREAD_SETNAME_NP) #if defined(__APPLE__) #define ceph_pthread_setname(thread, name) ({ \ int __result = 0; \ if (thread == pthread_self()) \ __result = pthread_setname_np(name); \ __result; }) #else #define ceph_pthread_setname pthread_setname_np #endif #elif defined(HAVE_PTHREAD_SET_NAME_NP) /* Fix a small name diff */ #define ceph_pthread_setname pthread_set_name_np #else /* compiler warning free success noop */ #define ceph_pthread_setname(thread, name) ({ \ int __i = 0; \ __i; }) #endif #if defined(HAVE_PTHREAD_GETNAME_NP) #define ceph_pthread_getname pthread_getname_np #else /* compiler warning free success noop */ #define ceph_pthread_getname(thread, name, len) ({ \ if (name != NULL) \ *name = '\0'; \ 0; }) #endif linuxGDB下动态链接库的调试(gdb) file (gdb) load #这条应该是可选的 (gdb) dir |

 2>查看系统默认的follow-fork-mode 和 detach-on-fork:
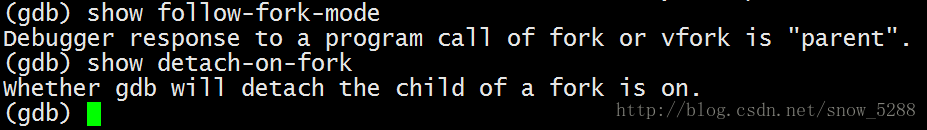 3>设置follow-fork-mode 和 detach-on-fork:
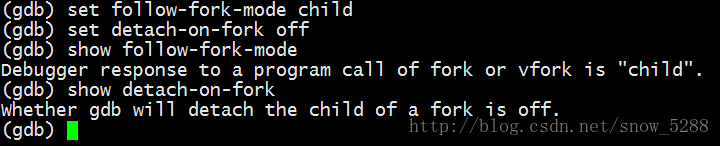 4>用l/list命令查看源代码(按enter翻页),分别在子进程和父进程相应位置下断点:
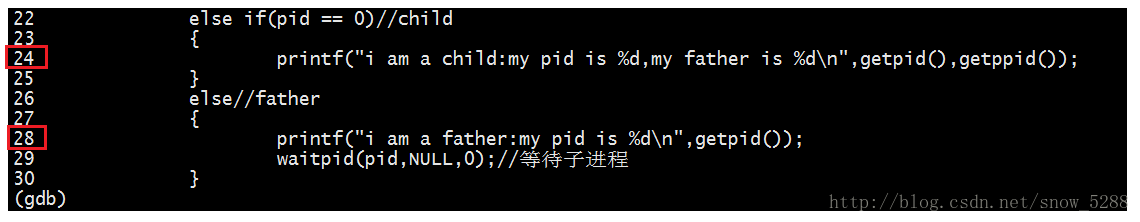
 7>其他
7>其他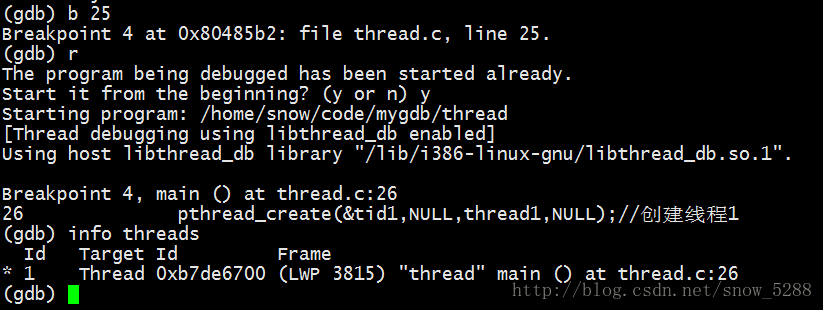
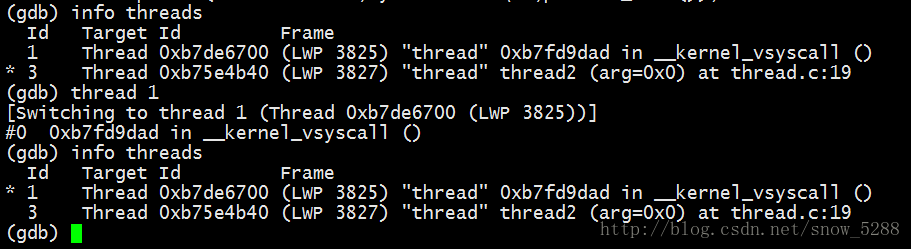 切换当前调试的线程为指定ID的线程。
【本文地址】